


The SCA Systems Map arose from the systems change thinking and methodologies that guided the work of the SCA’s Price Crisis Response Initiative. A systems approach shifts the focus from the individual parts of a system to how the parts are organized, recognizing that the interactions of the parts are not static, but dynamic and fluid. This approach also acknowledges that change is non-linear and happens at multiple levels over multiple time scales.
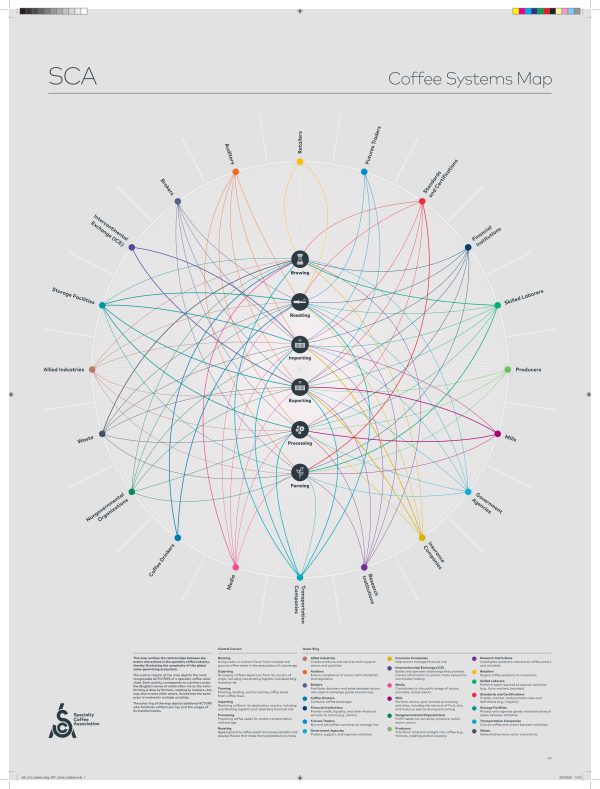
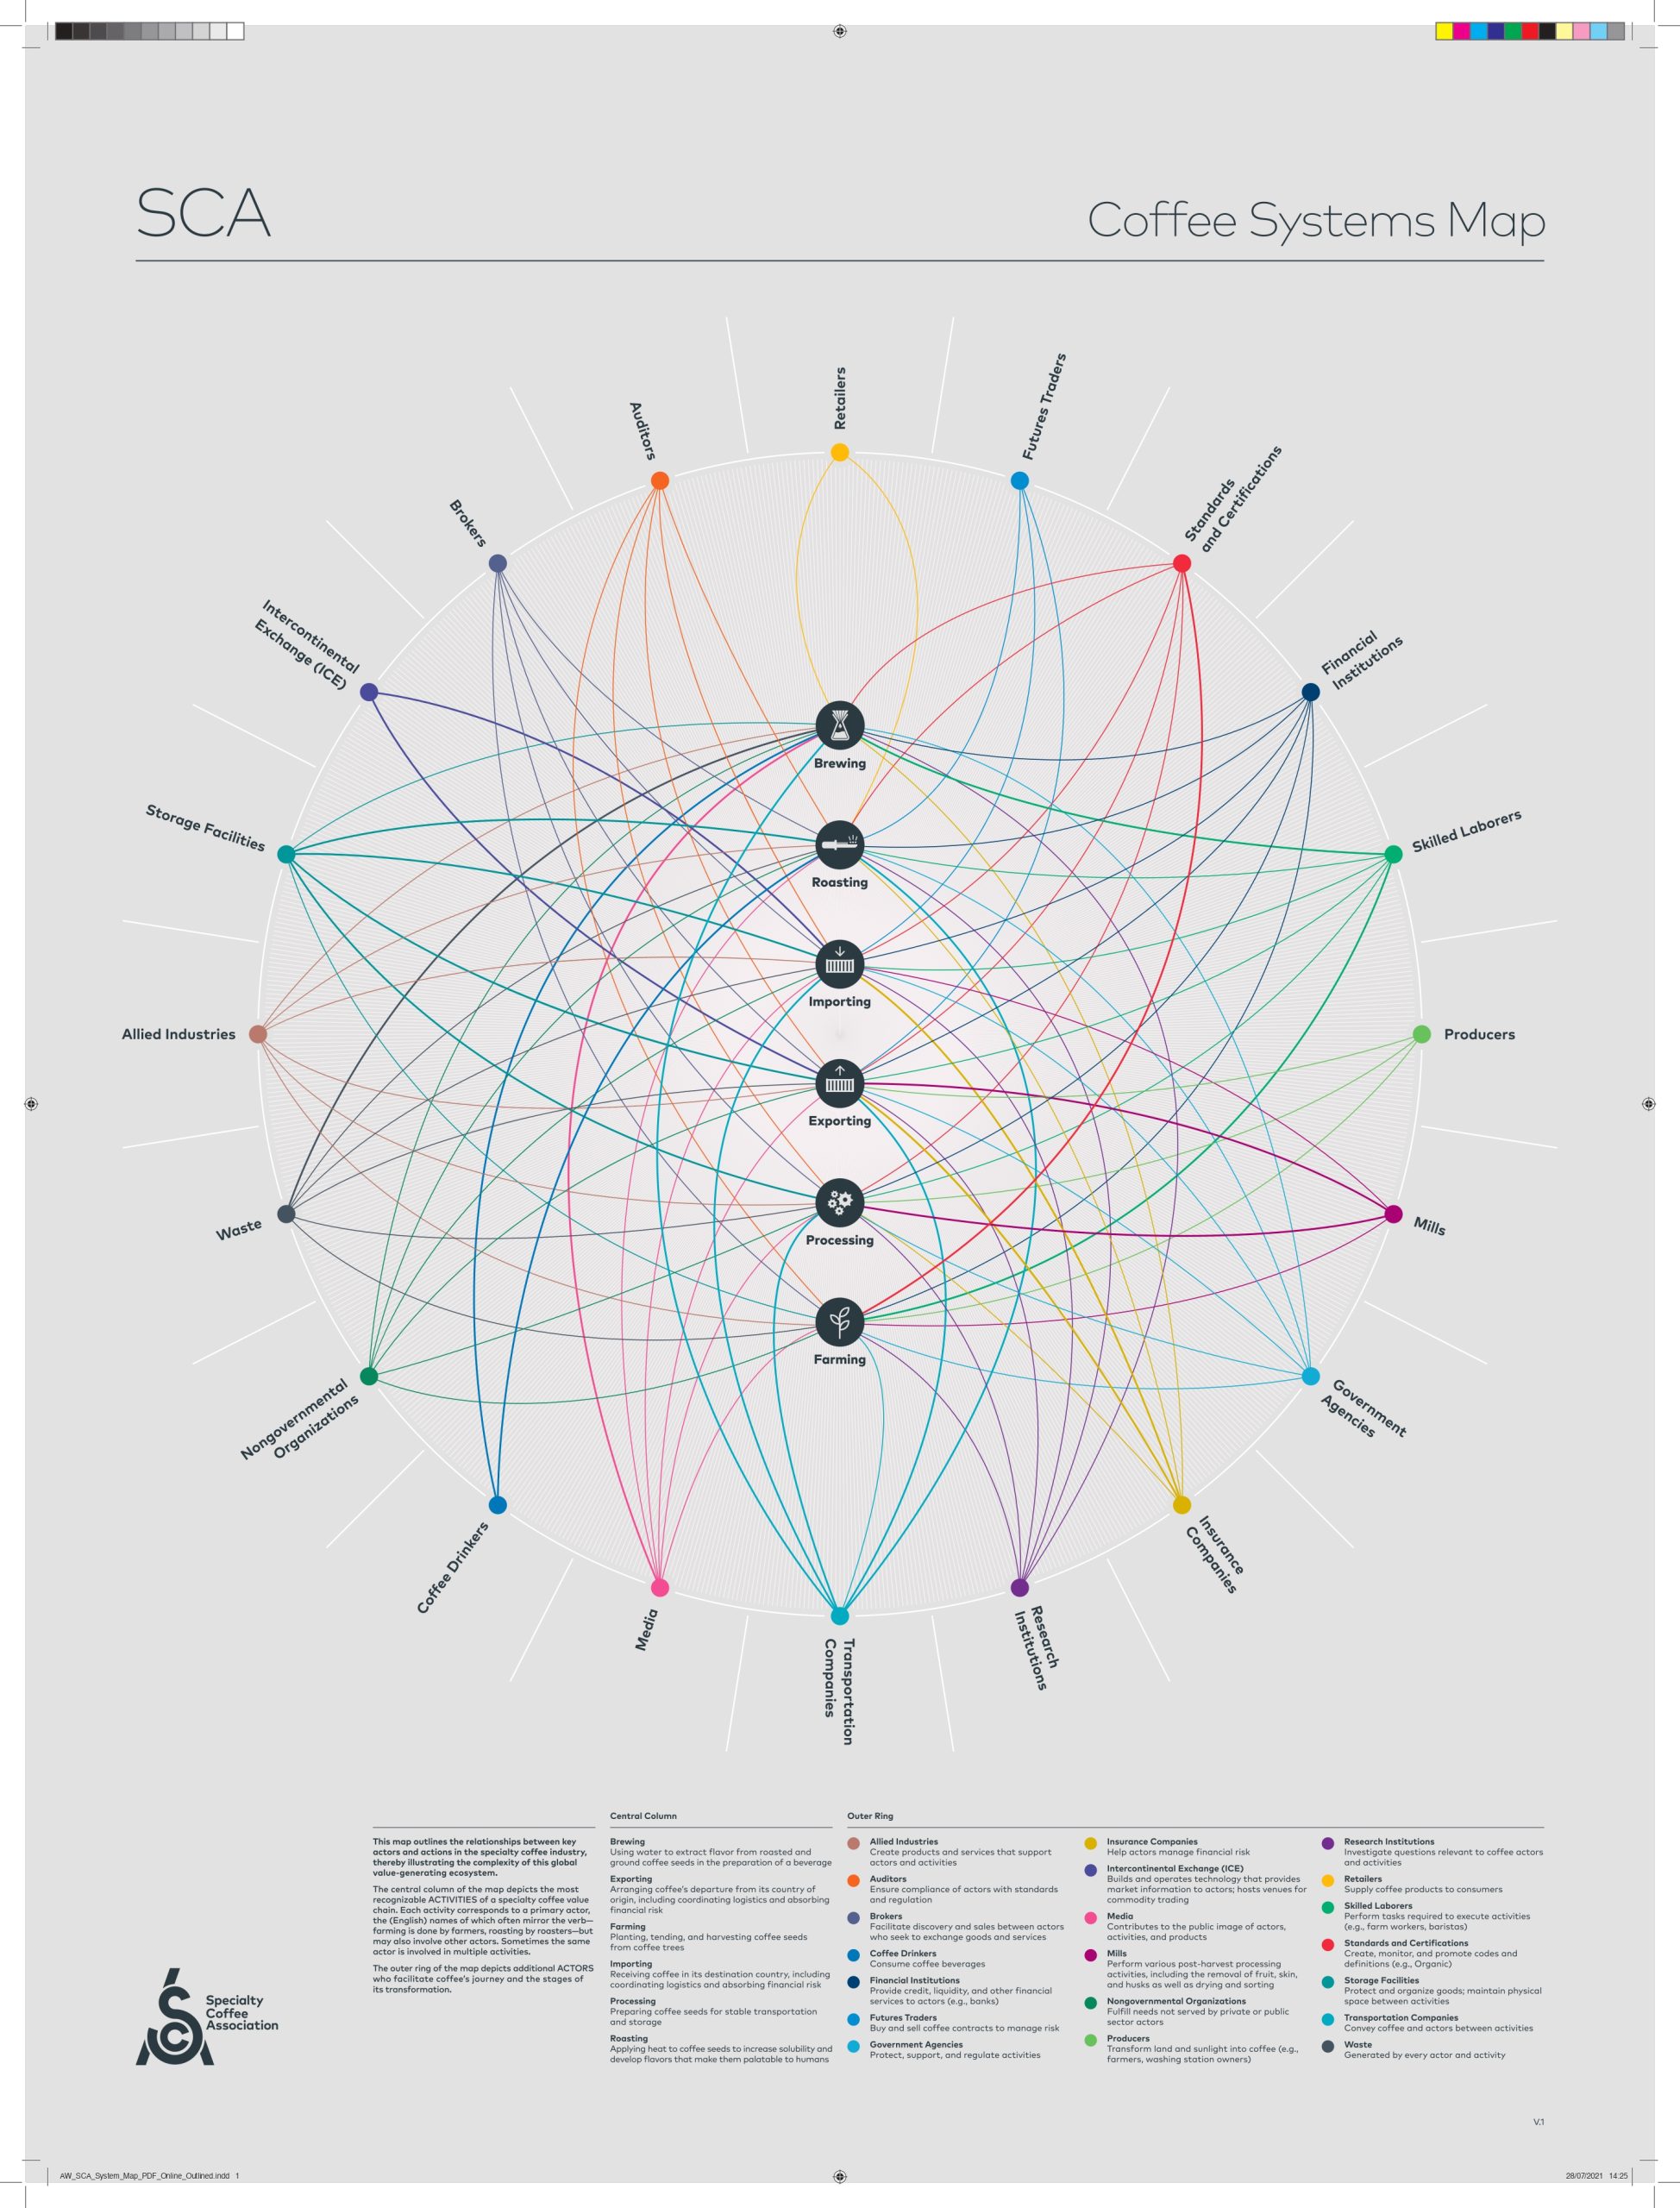
This map outlines the relationships between key actors and actions in the specialty coffee industry, thereby illustrating the complexity of this global value-generating ecosystem, while recognizing previously invisible actors and telling multiple stories.
The central column of the map depicts the most recognizable activities of a specialty coffee value chain. Each activity corresponds to a primary actor, the (English) names of which often mirror the verb–farming is done by farmers, roasting by roasters–but may also involve other actors. Sometimes the same actor is involved in multiple activities.


 Item is saved in your Wishlist.
